 A couple of times recently, I’ve encountered folks proudly using a 100% stocks allocation for their retirement savings.
This approach, they say, performs well. About 9.5% annually over roughly the last quarter century.
Further, going with a 100% stocks allocation keeps things simple and easy.
Finally, the risks? These folks say the risks aren’t that bad. (The standard deviation of a 100% stocks portfolio runs about 15%.)
I think I get the attraction of a 100% stocks portfolio. I’ve tried to listen carefully to the logic of 100% stocks proponents. But you know what? Even ignoring the stock market’s recent gyrations, I still think a 100% stocks allocation suffers from two gigantic flaws:
- Flaw #1: If you’re okay with the risks of a 100% stocks portfolio, you ought to diversify to earn a higher return.
- Flaw #2: If you’re okay with the returns of a 100% stocks portfolio–you ought to diversify to dial down your risk.
The two flaws sometimes don’t make sense to people. And if someone throws the phrase “modern portfolio theory” into the conversation, eyes glaze over. (Modern portfolio theory provides the math that explains why 100% stocks doesn’t work well.)
Let me, therefore, break this down into two points: First, what someone with 100% stocks should do if they’re okay with the risk of a 100% in equities. (I’ll explain how these folks can probably earn a slightly higher return without bearing any additional risk.)
Second, I’ll suggest changes an investor may want to consider if she or he is fine with a returns of a 100% stocks allocation but wants to bear less risk. (I’ll explain what these folks can usually do to earn the same return as 100% stocks but with considerably more safety.)
I’ll also describe how you can use the Portfolio Visualizer website’s backtest asset allocation tool to double-check my suggestions–and then maybe even assess the risks and historical returns of your own personal asset allocation.
How to Earn Higher Return
Let’s start by talking about how you can beat a 100% stocks allocation without taking on more risk.
To understand this opportunity and keep things really simple, you can compare three options:
- Option #1: Invest 100% of your money into US stocks.
- Option #2: Invest 100% of your money into real estate investment trusts, or REITs.
- Option #3: Invest 50% of your money into US stocks and 50% into REITs.
I picked the REIT index, by the way, because REITs over the last quarter a century have shown a low correlation with US stocks but have delivered, coincidentally, nearly the same average annual return as US stocks.
US stocks returned 9.58% from 1994 through 2017, for example, according to the Portfolio Visualizer website. And REITs returned 9.54% from 1994 through 2017. (The interval 1994 through 2017 is the longest time frame for which the data we need is available.)
The two investment options varied in important ways, however: For one thing, they showed different levels of variability in their returns: US stocks produced a standard deviation of 14.77%, for example, while REITs produced a standard deviation of 19.3%.
For another thing, REITs correlation with US stock market measured only .57 over this interval—which means (sort of) that REIT shares and US stocks zigged together or zagged together about half the time.
Note: That standard deviation describes the variation of returns around the mean or average. If you’ve never encountered the term before and don’t care too much about precision, you can sort of think about a standard deviation as kind of the average variation. For the mental health of readers who understand statistics and are going crazy about the previous sentence, let me say that a better, precise (and more complicated) definition appears here.
But here’s the really important thing to note: Even though both US stocks and REITs returned about the same percentage annually (between 9.54% and 9.58%) and even though REITs showed considerable more variability than US stocks (a 19.3% standard deviation versus a 14.77% standard deviation), a blended portfolio delivered a better outcome.
A 50% US stocks and 50% REITs generated a 9.99% average annual return over the longest period Portfolio Visualizer will model. But with a standard deviation equal to 15.06% so roughly (roughly) the same as 100% stocks allocation.
That’s big, right? Essentially, the same risk. But a nearly half a percent better annual return.
Over a quarter century, that extra return bumps the future value by about 10%.
What’s going on here? Well, it’s pretty simple really to describe even if the math behind the results get complicated. When you combine the REITs and the US stocks together, because the two asset classes show low correlation, you keep the portfolio’s risk lower than you’d expect.
If when US stocks zig, REITs zag about half the time (and vice versa), that dampens the volatility.
The other thing is, when you rebalance between these two asset classes with low correlation and nearly identical annual returns, you pick up a rebalancing bonus which in the example, adds about half a percent to the return.
Note: You can test the math—heck, you should–by using Portfolio Visualizer’s backtest asset allocation tool. Model the three asset allocations all at once, with one portfolio equal to 100% US stocks, another equal to 100% REITs, and the final one equal to 50% US stocks and 50% REITs. To perfectly match my results, run your calculations out through 2017.
But the main point is, you’ve boosted your return and future value without bearing additional risks. The trick? You need to combine asset classes with low correlation and then rebalance.
A caution: Going forward, you and I don’t know how asset classes will correlate. And we don’t know which asset classes will generate similar returns.
But you can surely find asset classes that aren’t perfectly correlated. (If this seems a stretch, consider how difficult it would be to assemble a handful of asset classes that perfectly correlate with US stocks over decades.)
Further, while you and I can’t reliably count on international stocks, REITs or other asset classes generating decent returns, we also can’t count on US stocks generating decent returns either.
How to Bear Less Risk
A 100% stock allocation also suffers from a related flaw: the high risk it causes you to bear. A 15% standard deviation means investors look at a wide wide range of outcomes.
Note: Our Monte Carlo simulation workbook lets you experiment with different investment standard deviations and see the portfolio outcomes in a line chart.
So let’s look at the math of using modern portfolio theory to dial down this risk.
To illustrate how this works, say you want to look at allocating 30% of your portfolio to long-term treasuries. That’ll radically dial down your risks, as we both intuitively understand.
Further, just to continue with the earlier discussion, let’s assume you split the 70% reminder between US stocks and REITs, so 35% in US stocks and 35% in REITs.
It turns out that this asset allocation produces the same expected return over the longest time frame that Portfolio Visualizer will model as the 100% US stocks approach.
In other words, you could invest 100% in stocks and over roughly the last 25 years, you would have earned about 9.58% according to Portfolio Visualizer. But that 100% stock allocation causes you to bear quite a bit of risk. The 100% stocks standard deviation equals nearly 15%.
However, if you allocate 30% to long-term treasuries and then split the remaining 70% evenly between US stocks and REITs, you earn 9.59% (so basically the same as a 100% stock allocation). But your standard deviation equals 10.52%, which means considerably less variability and volatility.
The obvious question, then, is why if you’re okay with the expected returns of a 100% stock portfolio are you bearing that much risk? Why not dial down your returns, if the expected return is “okay?”
The figure below shows a fragment from the Portfolio Visualizer backtest asset allocation tool. Portfolio 1 (the blue line) shows the 100% stocks allocation. Portfolio 2 (the red line) shows the 50% stocks and 50% REITs allocation. Portfolio 3 (the orange line) shows the allocation with 30% in Treasuries, 35% in stocks, and 35% in REITs.
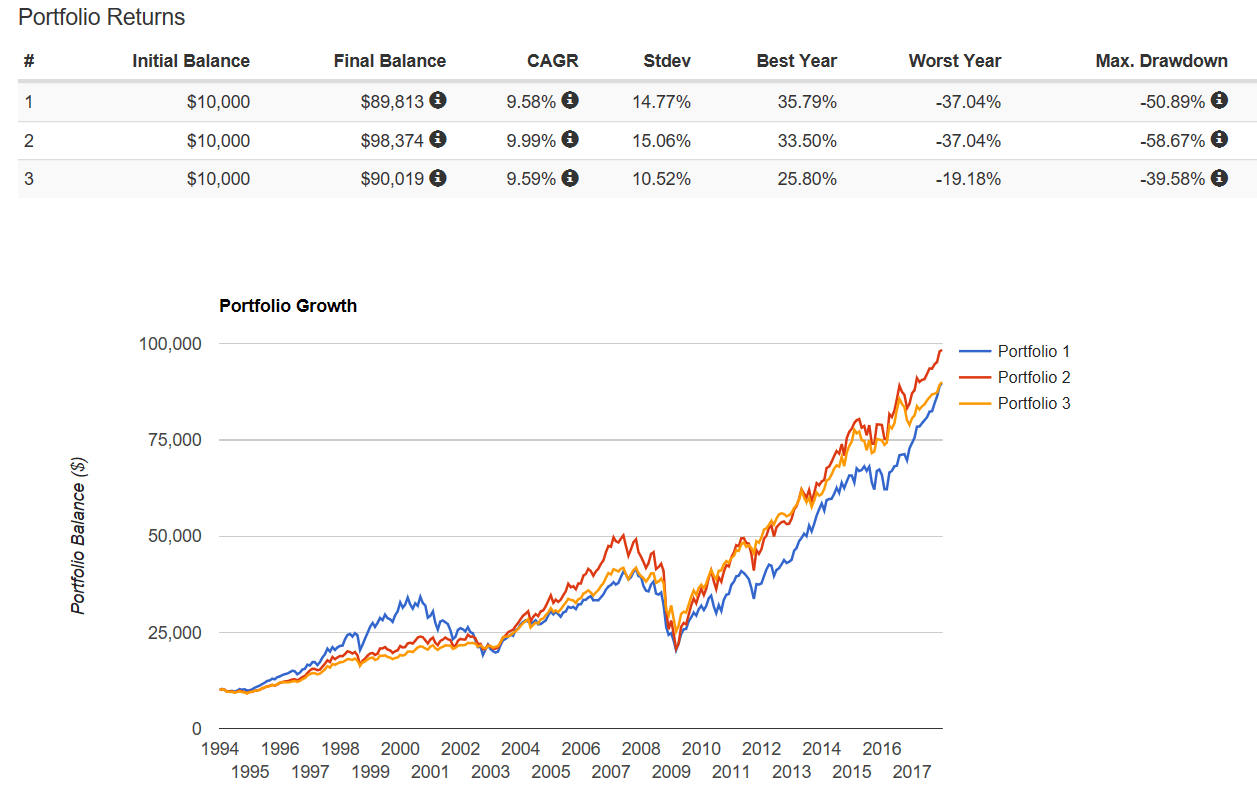
A quick handful of things to note about the line chart:
First, the orange and blue lines end at the same point. That makes sense. Those two portfolios generate the same annual return.
Second, the blue line shows more variability than the orange line—which makes sense—that’s the variability showing up visually.
Third, the red line shows a lot of variability too—but rebalancing means you end up with more money in the end.
Three Points in Closing
Let me quickly share three comments to wrap this up.
First, please don’t go out and use the “50% US stocks and 50% REITs” allocation. Or the “35% US stocks, 35% REITs, and 30% long treasuries” allocation. I picked these percentages and asset classes only because they cleanly illustrated the modern portfolio theory argument against a 100% US stocks portfolio. I think you and I ought to use orthodox asset allocations that lots of people have scrutinized and picked apart.
Note: If you’re interested in learning more about asset allocation formulas, download a free copy of my short monograph, The Thirteen Word Retirement Plan. The monograph, by the way, suggests you pick a target retirement fund and accept that fund’s asset allocation.
Second, know that if you experiment with different time intervals, the results bounce around. You want to play with this a bit so you understand. You want a good intuitive understanding that modern portfolio theory doesn’t work as cleanly as we both would hope (unfortunately). Further, as you will probably not be surprised to hear, past returns, standard deviations and correlations don’t reliably predict future returns, standard deviations or correlations.
Third, just so you know, modern portfolio theory does not protect you or me from a worst-case financial scenario. Or at least it doesn’t offer as much protection we want. From 2007 to 2009, for example, a sophisticated MPT-style portfolio got pretty beat up, too. (Take another peek at the line chart shown earlier.)