 Microsoft Excel makes it pretty easy for you to build a stock market Monte Carlo simulation spreadsheet.
No, sorry, this spreadsheet won’t let you run a hedge fund. Or engage in some clever leveraged investing strategy.
But a stock market Monte Carlo simulation spreadsheet can help you size up your investment portfolio. And give you a gut-level feel for the investment risks you bear.
Tip: If you just want to download the example spreadsheet, click here: TenSimulations40YearAccumulations. But, gosh, seriously, try to build the spreadsheet yourself. It’s a pretty quick project. Less than five minutes if you know Excel. And taking the do-it-yourself route will let you extend the spreadsheet if that’s something you later decide to do.
Building the Stock Market Monte Carlo Simulation Spreadsheet
You build the stock market Monte Carlo simulation spreadsheet in four parts: the inputs range, the statistics output range, the table of randomly calculated values, and then the line chart.
Inputs Range
To build the inputs range, enter the labels and values shown below into an Excel workbook:
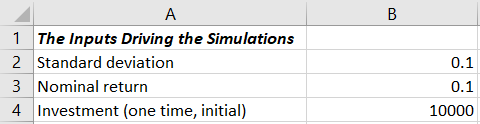
In other words, type the text shown in the worksheet range A1:A4 above into your Excel workbook.
And then enter 0.1 into cells B2 and B3 and then 10000 into cell B4.
What these values do, by the way, is set you up to simulate how your portfolio performs if you average a 10% nominal return, experience a 10% annual standard deviation, and start with $10,000.
Statistics Output Range
To build the statistics output range, enter the labels shown below into the same Excel workbook:
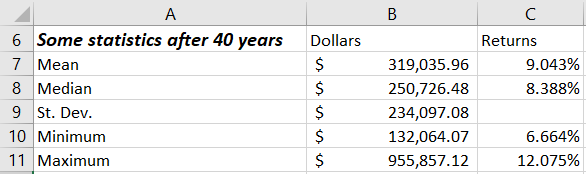
Then enter the following formulas into the indicated cells
B7: =AVERAGE(B54:K54)
B8: =MEDIAN(B54:K54)
B9: =STDEV(B54:K54)
B10: =MIN(B54:K54)
B11: =MAX(B54:K54)
These formulas will return errors and zeroes at first. But once you finish the next part of the stock market Monte Carlo simulation spreadsheet, the values in the range B54:K54 will show the ending investment balances. And then these formulas will return values.
At that point, the AVERAGE function will calculate the mean, the MEDIAN function will calculate the median, the STDEV function will calculate the sample standard deviation, and the MIN and MAX functions will return worst case and best case investment results.
To complement the ending dollar values, you’ll also want to enter the following rate of return formulas into the indicated cells:
C7: =RATE(40,,-$B$4,B7)
C8: =RATE(40,,-$B$4,B8)
C10: =RATE(40,,-$B$4,B10)
C11: =RATE(40,,-$B$4,B11)
The RATE function calculates the internal rate of return of the average, median, worst and best case simulations based on the 40-year accumulation.
All of these formulas work the same basic way, but to look at just the first formula which calculates the average return: =RATE(40,,-$B$4,B7)
The first argument, 40, specifies how long the accumulation period takes: 40 years.
The second argument doesn’t appear. (This is why the formulas show those two commas together.)
The third argument, -$B$4, specifies the starting value by referencing cell B4.
The fourth argument, B7, references the average ending value calculated by the formula in cell B7.
Simulated Ending Values Table
To build the simulated ending values table—this is where the actual Monte Carlo simulation calculations occur—first use the range A15:A54 to label the years. Then use the range B14:K14 to label the simulations. (The figure below shows a fragment of this part of the spreadsheet.)
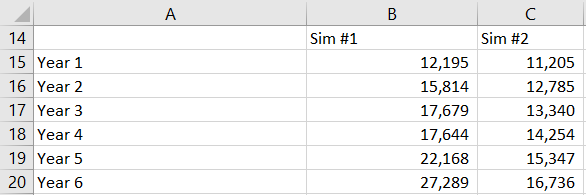
Next, enter this formula into cell B15:
=$B$4*(1+NORMINV(RAND(),$B$3,$B$2))
And this formula into cell B16:
=B15*(1+NORMINV(RAND(),$B$3,$B$2))
Tip: You can copy and paste these formulas if you want or if you have trouble.
The “magic,” if you want to call it that, happens with the NORMINV function.
Using the Excel random number function, RAND, and then the standard deviation value stored in cell B2 and the nominal return value stored in cell B3, NORMINV calculates a random annual nominal return when the mean equals 10% and the standard deviation equals 10%.
Note: Your formulas in cells B15 and B16 will not return the same values as the worksheet range above. The RAND function means your spreadsheet’s NORMINV function will be calculating random values.
After you’ve entered the “starter” formulas into cells B15 and B16, copy the formula in cell B16 into the worksheet range B17:B54.
Then copy the worksheet range B15:B54 into the worksheet range C15:K54.
At this stage, your stock market Monte Carlo simulation spreadsheet works. And every time you recalculate the spreadsheet, you will get a new set of statistics.
Tip: Press the F9 key to manually recalculate. And then do this a few more times, watching the various ending values and annual returns.
Adding a Line Chart
Can I suggest you add a chart sheet to your stock market Monte Carlo simulation spreadsheet?
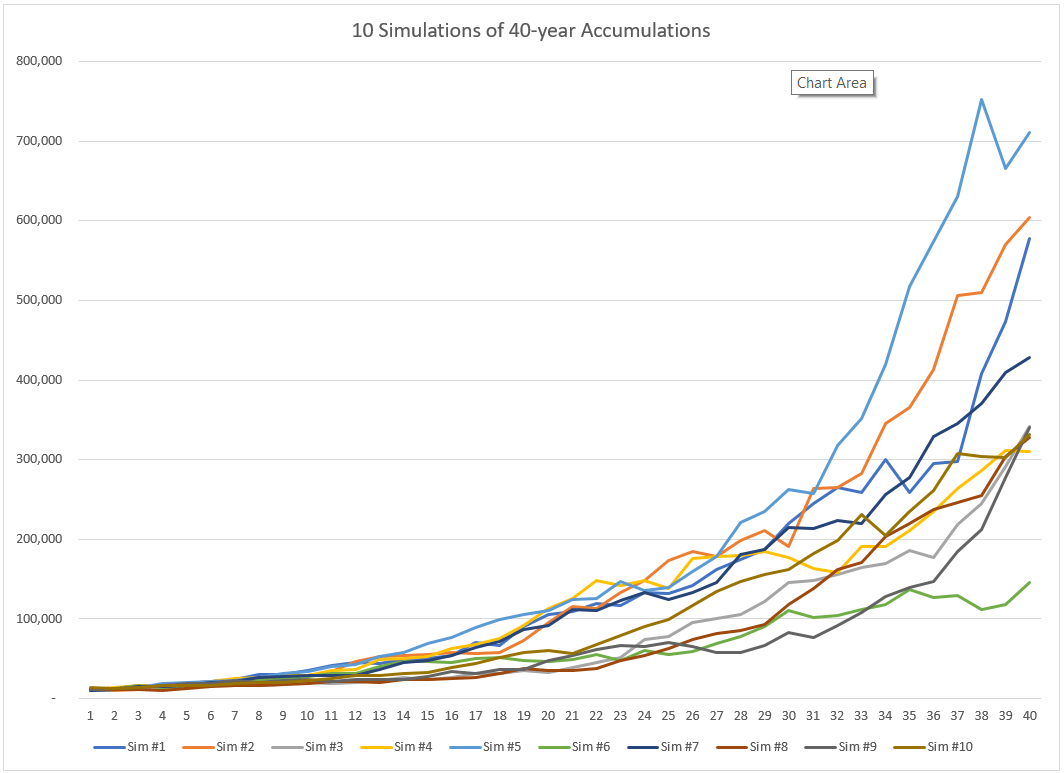
The line chart—especially if you look at the line chart while pressing F9 several times in a row—will graphically show you how much variability your “example” portfolio shows as you calculate and recalculate the formulas. (See the example below.)
To generate such a line chart, follow these steps:
- Select the worksheet range B14:K54.
- Press F11 to have Excel add a new Chart sheet to the workbook and draw a bar chart with the data from the selected worksheet range.
- Right-click inside the new chart to display the shortcuts menu.
- Choose the Change Chart Type command from the shortcuts menu and then, when Excel displays the Change Chart Type dialog box, select Line from the list of chart types and then click the specific line chart format you want. (Probably you want the first line chart, which is what I show above.)
Practical Uses of the Stock Market Monte Carlo Simulation Spreadsheet
On one level, the simulation spreadsheet is pretty amateurish. A sort of homemade toy.
Nevertheless, the spreadsheet’s calculations can help people better understand the range of possible rewards and risks baked into our portfolios. Especially if someone resets the nominal return and standard deviation inputs to values that match their investments.
Just so you know… Finance professor Jeremy Siegel pointed out that the over the really long run, stocks return on average about 9% and show about an 18% standard deviation. That’s probably an interesting set of input values to use if you’re investing in a 100% US stocks portfolio. (By the way, Siegel wrote a whitepaper about this, which is available here, and it provides more returns and standard deviations. And do note this: If you grab values from that whitepaper, use an arithmetic mean and not a geometric mean.)
And then be aware of the Portfolio Visualizer website’s Backtest Asset Allocation and Monte Carlo Simulation tools. They calculate returns and standard deviations for specific portfolios and asset classes based on historical data since 1972. (If you poke around the Portfolio Visualizer website, you may end up with inputs that show about a 10% average return and a 15% standard deviation for portfolio composed entirely of US stocks. For a 60% US stocks and 40% bonds portfolio, the tools show about a 9% average return and a 9% standard deviation.)
A Postscript: You can Customize the Spreadsheet
A quick final comment: You can (if you want) expand the accumulation period and the number of simulations your spreadsheet performs each time you calculate.
- To extend the accumulation period, copy the last row into a bunch more rows. For example, to look at a century, copy the 40th row into the next 60 rows and then adjust the formulas in the range B7:B11 so they reference the last row of simulated values and adjust the RATE formulas in C7:C11 so they indicate you’re looking at 100 years and not 40 years.
- To perform more simulations with each recalculation pass, copy the range of values in column K into a bunch more columns. For example, if you copy the contents of column K all the way out to column ALM, you will calculate a thousand scenarios each recalculation. Then adjust the ranges used in the formulas in B7:B11 so they include all your scenarios (such as through column ALM if you’re running a thousand scenarios with each recalculation).
- To create a new line chart for the larger data set of data, repeat the steps as described earlier for creating a line chart, but select the new expanded worksheet range as the to-be-charted data . If you decide to look at a thousand scenarios over a century, for example, you would plot the worksheet range B14:ALM114.
Other Related Blog Posts
Retirement Plan B: Why You Need One