 Can I suggest you need a retirement plan b? No, I know. You’ve probably already got a “plan a” for retirement. You wouldn’t be reading a blog post about a retirement plan b if that wasn’t the case.
But I think you need a plan b. And probably more than you realize right now.
In this short post, therefore, I’m going to make the case for you needing a plan b.
Then, in posts over the next three days, I’ll provide instructions about how to use the FIRECalc, cFIREsim and Portfolio Analyzer tools to calculate what your retirement plan b needs to look like.
Finally, on Friday in a final post, I’ll try to provide useful tips to help you build a practical “plan b”.
The Story behind Retirement Plan B
The best way to explain why you need a plan b is with a very short story. So let me tell that story.
Three neighborhood friends, George, John and Thomas, grew up together and, as luck would have it, ended up with the exact same job.
But it gets weirder. In inflation-adjusted terms, all three friends saved the exact same amount annually into their individual retirement accounts ($5,500 a year for 35 years) and used the exact same asset allocation formula which was 75% in US equities and then 25% in long term bonds.
George after 35 years ended up with $620,358. That might not surprise you. That accumulation reflects the average outcome an investor might anticipate based on the last 150 years of investment returns. If you know how to use a financial calculator or spreadsheet, you can even dig into the calculations and see that George earned about a 6% annual real (or adjusted for inflation) return. And that sounds, seems, right.
But you might be shocked to hear that the other two men ended up in distinctly different places, as shown in the table below. Note, by the way, that I’ve adjusted these values for inflation.
| Investor | Future IRA Balance |
|---|---|
| John | $231,314 |
| George | $620,358 |
| Thomas | $1,007,843 |
John unfortunately experienced the worst possible outcome, ending up with about $230,000.
Thomas experienced the best possible outcome, ending up with over $1,000,000.
Note: I used the cFIREsim tool to calculate these values. In a post later this week, I’ll explain how you can make these calculations yourself for your specific retirement plan.
But there you see it, the reason for a retirement plan b: While the average outcome may work just great, there’s a chance an investor won’t receive a median outcome.
Most discouraging, you may end up with an outcome that’s strikingly worse that your “plan a” anticipates.
But let’s keep going with this.
Deeper in the Weeds of Retirement Plan B
Talking worst case or best case is interesting, maybe, but theoretically anything is possible. So am I over-reacting by spotlighting the worst case and best case scenarios from the last 150 years? Am I grossly exaggerating the variability in possible retirement plan outcomes?
I don’t think so.
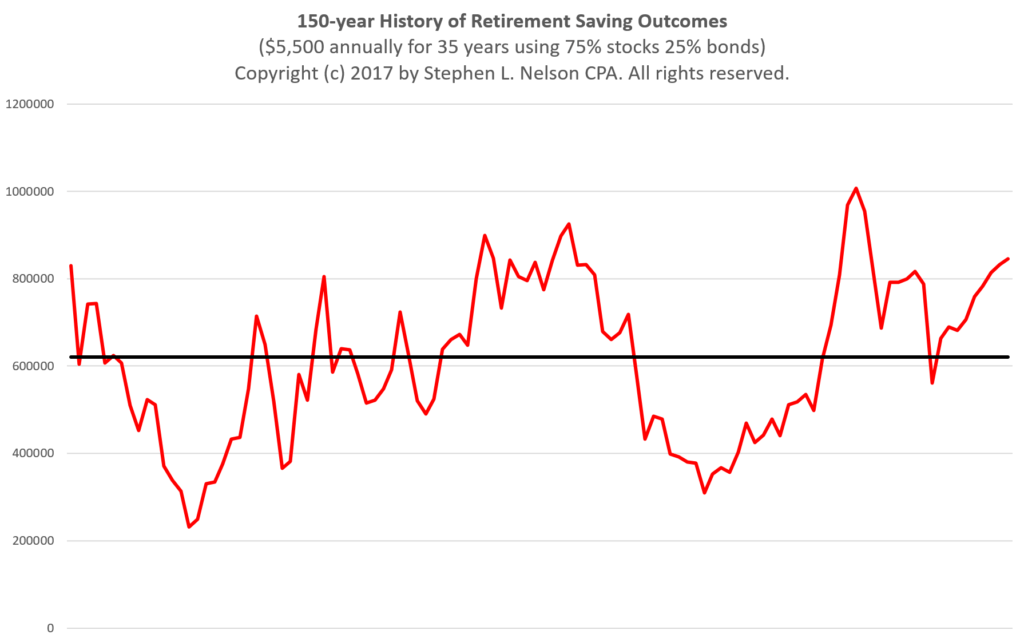
Take a look, for starters, at the line chart shown below. It depicts each of the retirement account balances you could have ended up with by saving $5,500 a year for 35 years any time over the last roughly 150 years. The red line plots the different amounts accumulated (starting with the 35 year accumulation that begins in 1872 and ends 1907). That dark black line shows the median return over the period depicted.
Note: If you have your own blog and want to reuse this graphic, you have my permission to do so. Please, though, provide attribution and link back to our Evergreen Small Business blog.
Three obvious points to make using the line chart. First, notice how often, how regularly, the actual end result of the same retirement plan produces a result way different than the median expected value of roughly $620,000.
Second, any time the red line falls beneath the dark black line, you’ve got a “retirement plan b” scenario. A little shortfall doesn’t matter of course. You or I can work our way around that. But a big shortfall? That’s the issue.
A third point, which isn’t really my focus but important to note: We’re discussing here the idea of a “plan b” to deal with a shortfall. But lots of time the outcome ends up better than we might expect. You might end up with, well, a windfall.
Returning to the earlier short story about George, John and Thomas, you or I might end up like John… but we also could end up like Thomas.
Let me provide a table, too, to give you the actual adjusted-for-inflation outcomes by percentiles:
| Percentile | Savings |
|---|---|
| 10th | $371,485 |
| 20th | $437,551 |
| 30th | $511,970 |
| 40th | $548,222 |
| 50th | $620,358 |
| 60th | $674,830 |
| 70th | $730,135 |
| 80th | $800,482 |
| 90th | $832,879 |
| 99th | $966,888 |
The data from the table provides more context, hopefully.
Of course, you and I probably can’t plan for the absolute worst case scenario. Just as we can’t plan for the absolute best case scenario.
But probably we still want a “retirement plan b” so things work out financially for us if some below-average outcome occurs.
Having a “plan b” for a 40th percentile or 30th percentile or maybe even a 20th percentile outcome seems prudent.
That’s enough background for now. Over the next week, I’ll provide follow-up blog posts that talk about how to model with more precision the range of outcomes you want to consider for your own “plan b.”
But to close here, let me throw out three comments that put us at a good place to stop:
Closing Comments
A first comment repeats something I said earlier but which is so important I want to say it again. Even people who use the identical—the identical—investment plan can end up with radically different results. You and I might save the exact same amount over the exact same number of years using the exact same asset allocation formula. Yet, you could end up with a great result… and I could end up with some amount far, far less than great. That’s worth ruminating over…
Note: You start ruminating on this variability and you may get the shivers thinking about where else in life, employment, business or families this same variability in outcomes occurs. I know I do…
A second thing to note: You don’t hear people these days talk much about variability in retirement plan outcomes. But that makes sense even if it isn’t smart. Few of today’s retirees needed to experience a bad, way-below-average outcome. People who retired in 2008—the bad outcome of the last roughly 23 years—ended up at the 42nd percentile. (Take another peek at the earlier line chart and notice that most recent drop below the median. That’s the 2008, 42nd percentile outcome.) Every one else enjoyed an above-average, Lake Woebegone result. You can understand why people don’t think about bad outcomes obviously, but you and I don’t want to rely on above average outcomes continuing forever.
Third, this comment: The “plan b” stuff relates to safe withdrawal rates, but it isn’t the exact same issue. The safe withdrawal rate discussion talks about how you and I draw down retirement savings in light of variability in returns when we’re retired. In contrast, the retirement plan b discussion talks about how you or I accumulate savings over the years we work in light of variability in returns. Obviously, people who are still working need to think about variability in returns not just during retirement but also during their working and savings years.
Note: Just so everybody is on the same page, the term “safe withdrawal rate” refers to the percentage of your retirement savings you can safely draw during retirement and not have to worry too much about running out of money. Many people think 4% works as a safe withdrawal rate and everybody else who thinks about safe withdrawal rates likes to argue about whether 4% is the right number.
Related Retirement Plan B Posts
All the posts this week explore the “retirement plan b” subject, but you might also find these other semi-related blog posts useful for your thinking:
$10,000,000 Individual Retirement Accounts and 401(k)s Really Possible?
Absurdly Good Retirement Outcomes: What Small Business Owners Can Learn From Public Employee Plans
Why You Don’t Need to Worry About Income Taxes During Retirement
 Also, on the off chance you need a retirement plan “a”, go ahead and grab a free copy of my “Thirteen Word Retirement Plan” available here.
