
Over the last few days, the Evergreen Small Business blog has described why and how you need to develop a “plan b” for your retirement.
On Monday, the blog talked about why you need a “plan b.”
A couple of days ago, for example, the blog described the steps for using the popular FIRECalc tool to make the necessary calculations.
Yesterday, the blog described the steps for using the more powerful but also more complicated cFIREsim tool to do the same work.
Today, I want to describe something a little different—which is how to use the Portfolio Visualizer tool to use another approach for understanding a likely range of outcomes for your retirement savings.
The Portfolio Visualizer Monte Carlo Simulation tool to identifies the range of outcomes that separates the 25th percentile from the 75th percentile.
Note: You can get more granular information about outcomes using cFIREsim, which I described in yesterday’s post. But you have to go to more work. Maybe someday you’ll want to go to that extra work… but if you’re just trying right now to get a quick sense of the “retirement plan b” issue, Portfolio Visualizer works well.
Using a Monte Carlo Simulation
You should find the Monte Carlo Simulation tool surprisingly easy to use. Simply follow these steps:
- Open the Portfolio Visualizer home page using this link portfoliovisualizer.com
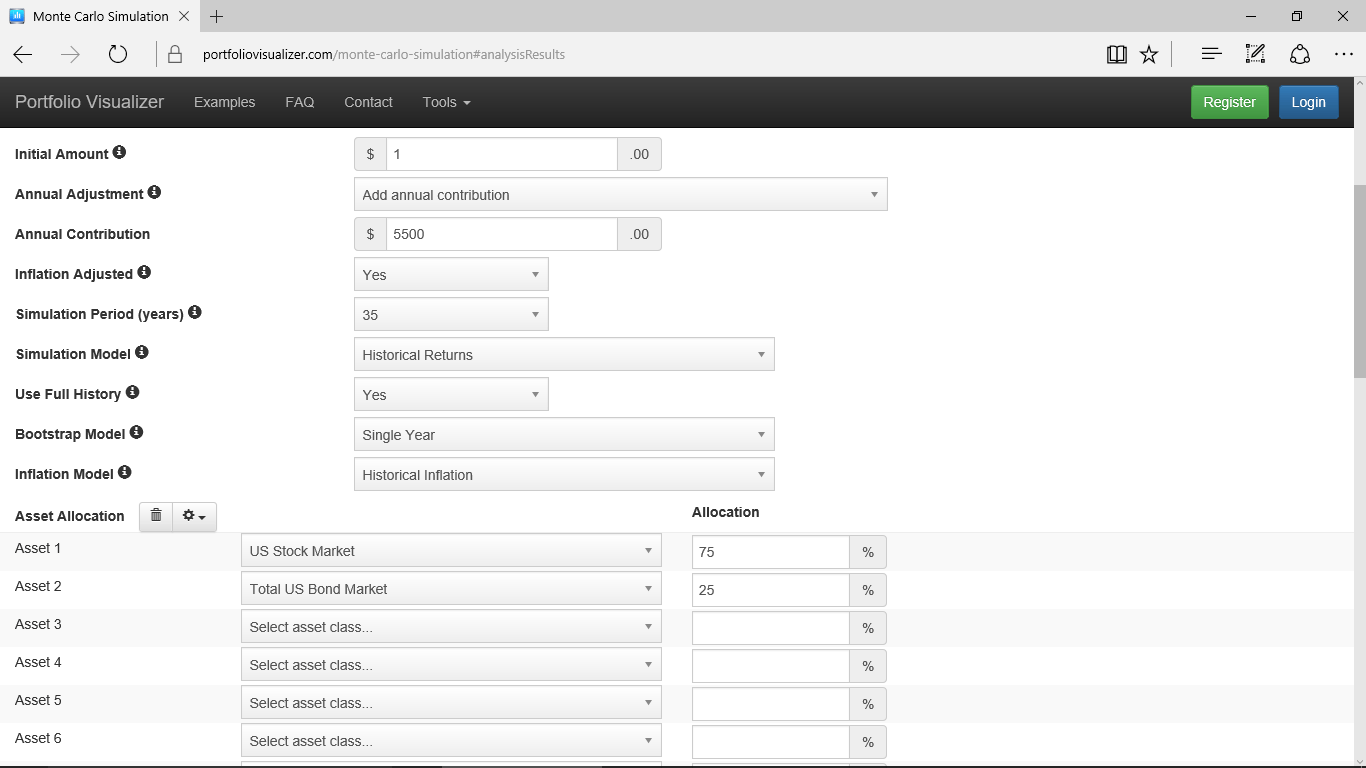
- Scroll down the page and click the Monte Carlo Simulation link to display the webpage you’ll need to do your simulation. The Monte Carlo Simulation web form appears (see Figure 1). Note that you can click this image to get a larger, more readable copy.

Figure 1 - Enter your current retirement savings into the Initial Amount text box. (If your current savings equals zero, enter 1 into the Initial Amount text box. You can’t enter a 0 as the Initial Amount.)
- Set the Annual Adjustment drop-down box to Add Annual Contribution.
- Enter the amount you’ll annually contribute to your retirement savings in the Annual Contribution text box. (If you will save $5,500, for example, enter 5500 into the Annual Contribution box.)
- Select one of the “number of years” entries from the Simulation Period (Years) drop-down list box. You can’t choose any old number of years for your simulation. Rather you’ll need to select the simulation period that most closely matches your remaining years of saving money: 5, 10, 15, 20, 25, 30, 35, 40, 45, or 50.
- Click the Asset Allocation button (it shows a gear) and select the asset allocation formula that matches or most closely matches yours. After you do this, Portfolio Analyzer enters the correct percentages for the selected asset allocation formation in the Allocation text boxes.
- Adjust the percentage values shown in the Allocation text boxes from whatever Portfolio Visualizer enters to whatever matches or nearly matches your asset allocation.
- Click Run Simulation button to run the Monte Carlo simulation of outcomes for your retirement savings plan.
Reviewing Monte Carlo Simulation Results
After you click Run Simulation, Portfolio Visualizer runs the Monte Carlo simulation and delivers probably the cleanest, most understandable results of any of the tools I’ve described this week for retirement plan b thinking.
The Monte Carlo Simulation Results page includes the median balance, 25th percentile balance, and the 75th percentile balance for the retirement savings plan, giving you not just a median outcome but both the 25th and 75th percentiles which you can use for your “retirement plan b” thinking. (Obviously, for a “plan b” you probably want to look at that 25th percentile.)
Further, and very usefully, the Monte Carlo Simulation Results page plots the median, 25th percentile, and 75th percentile in a line chart that cleanly shows a range of expected savings amounts you might start retirement with.
Figure 2 shows this web page. You can click the image to get a larger, more legible copy to read.
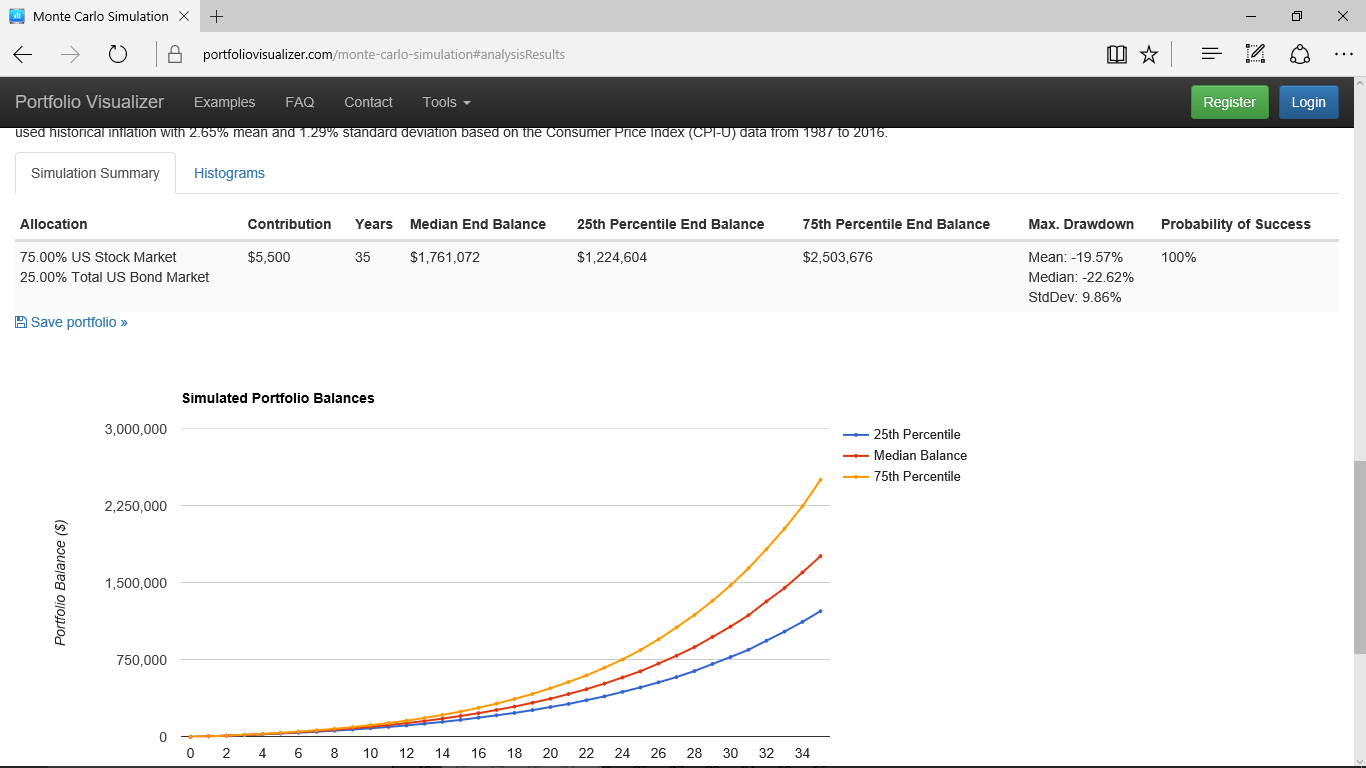
But an important note: A potential problem exists with the Portfolio Visualizer’s Monte Carlo simulation. The calculations show inflated dollars rather than real dollars which have the inflation “wrung out” of the numbers.
As a result, you can’t compare directly these values to those you calculate using FIRECalc or cFIREsim which are adjusted for inflation. Nevertheless, you may still find these Monte Carlo values useful. The range from 25th percentile to 75th percentile shows you the relative size of the range within which your and my retirement plans need to work.
Further, the Monte Carlo simulation results page provides good, detailed information on the inflation rates “baked into” the calculations. If you deflate these calculation results, they don’t closely match the results that flow out of FIRECalc and cFIREsim–but they sort of get close. By the way, the FIRECalc and cFIREsim results don’t match each other perfectly either, but they mesh pretty neatly.
Other Resources about Retirement Plan B
And that’s all you need to know to use the Monte Carlo Simulation tool that Portfolio Visualizer supplies in order to quantify what your retirement plan b needs. As I’ve done for each of these blog posts about the whole retirement plan “b” subject, let me list here the other blog posts that may also help you think concretely about your retirement planning:
$10,000,000 Individual Retirement Accounts and 401(k)s Really Possible?
Absurdly Good Retirement Outcomes: What Small Business Owners Can Learn From Public Employee Plans
Why You Don’t Need to Worry About Income Taxes During Retirement
 By the way, if you don’t your retirement plan “a”, download a free copy of my “Thirteen Word Retirement Plan” available here.