
Last week, I blogged about the unreliability of long run stock market returns. And to provide an angle, I talked about and around the long run stock market return chart that financial writers inevitably include in their books.
The blog post generated unusual publicity (at least relative to this blog’s usual situation) prompting threads at both the Mr. Money Mustache online forum (see Unreliability of long return stock market returns) and at the Bogleheads online forum (see Are long run returns reliable).
I’m happy to report that many people already knew all about the issue I talked about. Some people read the post and responded, “Yeah, okay… I get that.” And others suggested the math and the logic didn’t really make sense.
I need to take responsibility for that. As the one who started these discussions either directly or indirectly, I kind of feel an obligation to clearly describe the issue I introduced.
Reviewing the Long Run Stock Market Return Chart
In the original blog post, I showed a line chart that depicted historical average, worst case and best case portfolio real returns if someone annually saved $10,000 (such as into an IRA or 401(k)) and allocated 75% to stocks and 25% to bonds. (That first line chart’s longest accumulation period was thirty years. Some criticized that as too short, so I beefed up the chart below to show accumulation periods as long as forty years.)
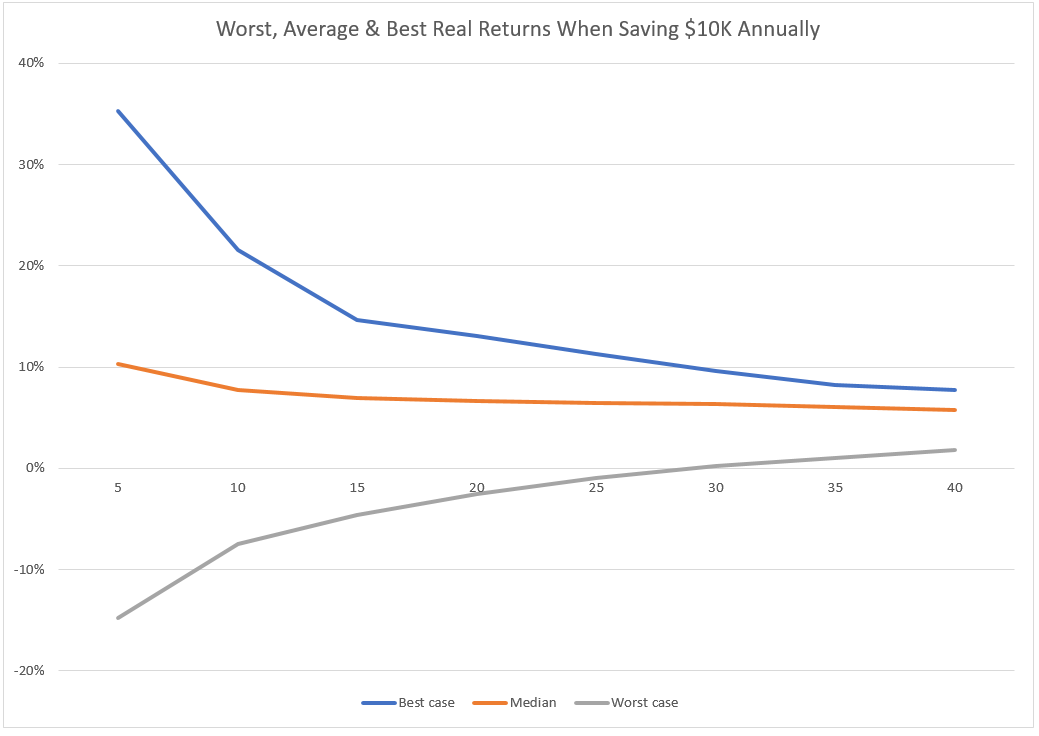
Now the common message writers usually want to convey when they use a chart like this is that over time, the range of returns narrow. And that’s true, I guess.
But another equally important message of this chart is that though the average returns look pretty steady (it’s roughly 6% annually), a wide gap exists between the worst case and the best case.
That range from worst to best real return at the 40 year marker, for example, runs from 2% to 8%. Which is a pretty big gap.
A Better Long Run Stock Market Return Chart
Lots of people got the point of my line chart and the associated commentary. But more than a few people just couldn’t accept the conclusion that though those two lines seem to converge, wide variability in outcomes still occurs.
You know what? I should have included another chart in that original discussion, a chart like the one shown below.
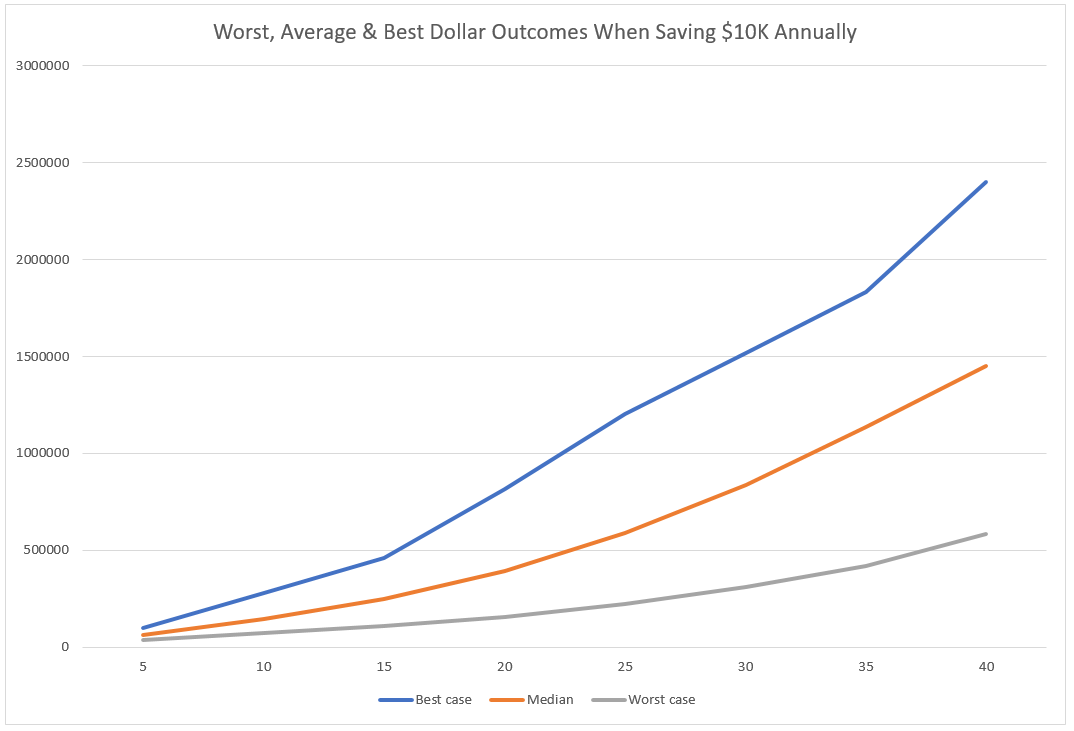
See that orange line? That’s the dollar balance someone accumulates if they earn the average 6% real return.
Further, if you or I use a long-run average real return to forecast our future retirement savings, we’re saying we think we’ll end up on that line,
But history says that’s pretty unreliable. The historical data available (I used cFIREsim for these calculations, as described in the original post) says you might end up anywhere between the blue and the gray lines.
And this important point from the chart: Time doesn’t narrow the range of outcomes. Time widens the range.
You and I can’t therefore assume that things will “average out” to the point where we get an “average like” return.
People posting in the online forums about this blog post asked a variety of questions and shared a number of constructive comments. Let me make some clarifications here about those.
Clarification #1: Not the Same Thing as Sequence of Returns Risk
Some people wondered out loud whether this variability reflects “sequence of returns” risk, a topic that’s critically important when you and I plan “drawing down” our savings in retirement.
My answer: I don’t think so.
My reasoning: Sequence of returns risk refers to the awkward reality that, for example, even if your portfolio earns 6% a year you maybe can’t plan to safely draw 6% a year because you don’t know the sequence of the annual returns you’ll earn.
For example, if one investor earns 3% for the first 15 years of retirement and 9% for the last 15 years of retirement, his average return is 6%. But if he draws an amount equal to 6% of his starting balance, he runs out of money.
If another investor earns 9% for the first 15 years of retirement and 3% for the last 15 years, her average return also equals 6%. But if she draws an amount equal to 6% of her starting balance she ends up with nearly twice as much money as started with.
Both investors, however, average that 6%. (Sort of…)
What I’m talking about is when someone experiences something less than or more than the long run average. 5% or 4% or worst. Or 7% or 8% or better.
Clarification #2: A Suggestion to Avoid Stocks?
Some people commenting on the original post asked if I was suggesting they abandon the stock market.
Let me be clear: I was not suggesting that.
My own asset allocation is 70% equities and 30% in US treasuries… a formula that follows as closely as I can the suggestions David Swensen makes in his wonderful book “Unconventional Success.” I plan to continue to follow this asset allocation for the foreseeable future.
Clarification #3: A Suggestion a Worst or Best Case Outcome is Likely?
I got the distinct sense some people wondered (or worse, worried) I was suggesting we were now looking at a worst case scenario for the future. Like Japan experienced. Perhaps based on historically high US stock market valuations.
Let me clear about this: I have no idea.
What I do think: We will probably see lots of bouncing about in returns over the coming decades. Because that’s what we often see.
By the way, what I am trying to do in my investing—and what I am bold enough to suggest you do, too—is build in some cushioning and try to plan on maintaining some financial flexibility.
I observed in the very first blog post that started this whole “variability in outcomes” series that many current retirees have earned average or better returns for the thirty or forty year accumulation periods they experienced (see here for the chart that depicts this: Retirement Plan B: Why You Need One.) But that can’t continue, right?
This isn’t Lake Wobegon, the fictional town Garrison Keillor told stories about… the town where all the kids were above average.
Clarification #4: A Suggestion to Move to Alternative Asset Classes?
Finally, a few people suggested I was arguing investors should move away from traditional asset classes (such as stock and bond index funds) and into alternative asset classes.
If I left anyone with that impression, I apologize. I do think alternative assets make sense for a few people in special case situations, as I had planned to talk about this week.
But I will repeat here what I said in the last paragraphs of an earlier blog post about the Bogleheads investment philosophy:
…let me again say that the basic theory of the Bogleheads approach works really well. Low-cost index funds and a common sense asset allocation formula work better than most new investors realize. As a result, if you can run a savings and investment plan based on the Bogleheads investment philosophy, well, I don’t think there’s any simpler or surer way to invest successfully in traditional asset class investments. (I’ve used such a strategy myself for decades and have no plan to stop. Ever.)
Final Words on the Long Run Stock Market Returns Chart
Two actionable insights fall out of this discussion of the unreliability of long run stock market returns and then the mixed messaging of the typical long run stock market return chart.
First, this simple point: Wide variability in outcomes occurs. (You want to know that and plan for that.)
Second, if this is new to you, possibly you want to revisit your asset allocation formula and your risk assessment because possibly you’ve misunderstood the risk you bear in your investing.
Some Related Posts
Retirement Plan B: Why You Need One
Unreliability of Long Run Stock Market Returns
cFIREsim Retirement Plan B Calculations